Collections Item Detail
Report on Hoboken YMCA.: Studies of the Work of Hoboken, N.J., Association Presented to Board Directors, Nov. 15, 1932.
2001.126.0083
2001.126
Staff, Collected by
Field Collection
Museum Collection.
1932 - 1932
Date(s) Created: 1932 Date(s): 1932
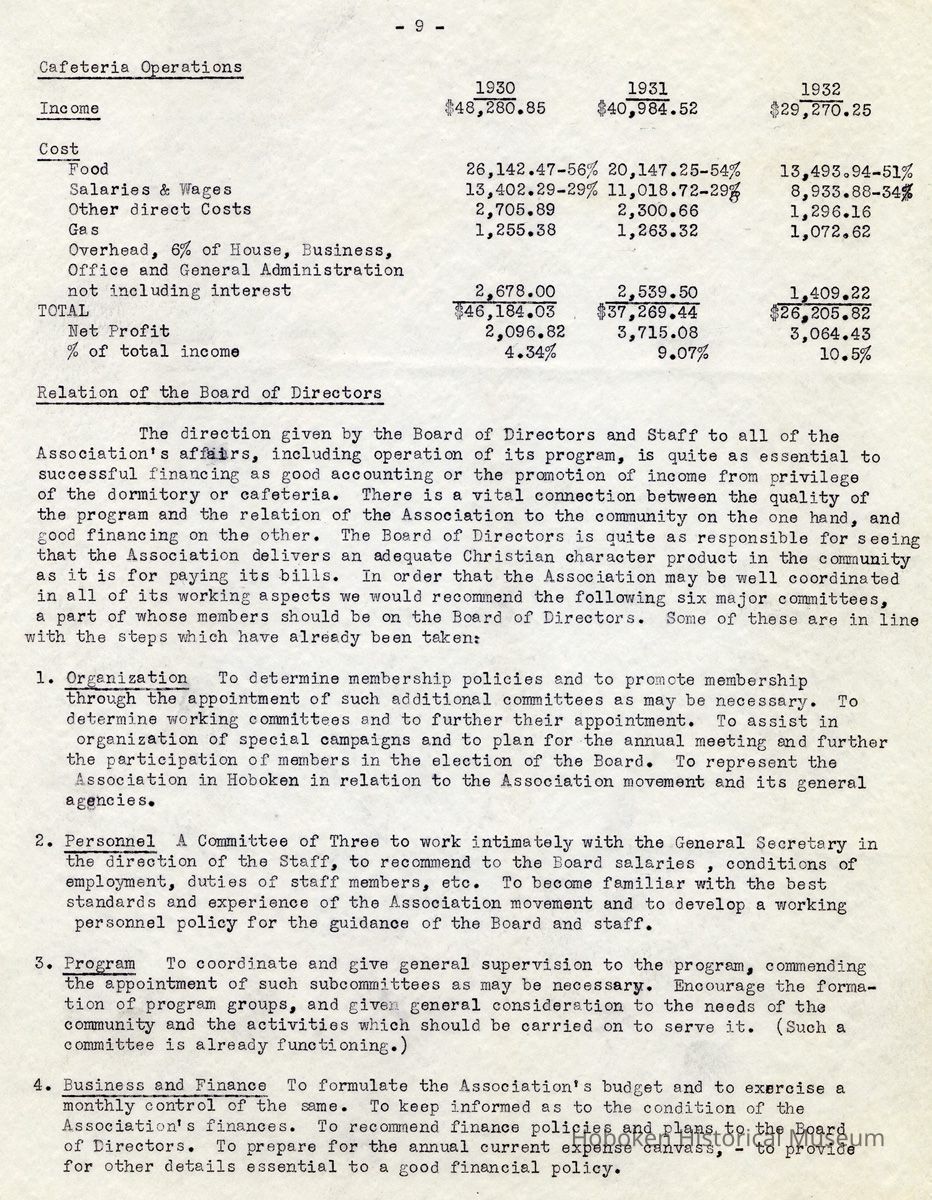
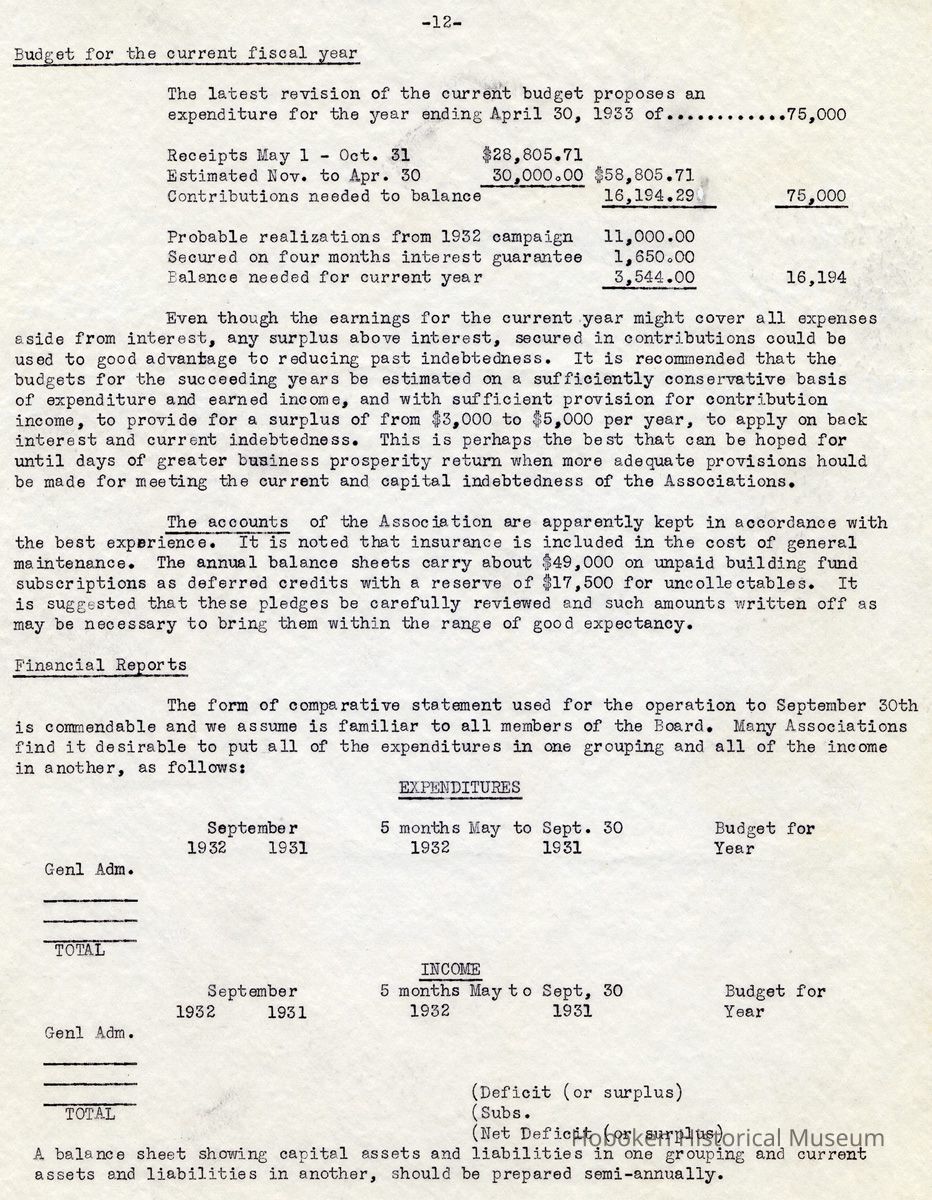
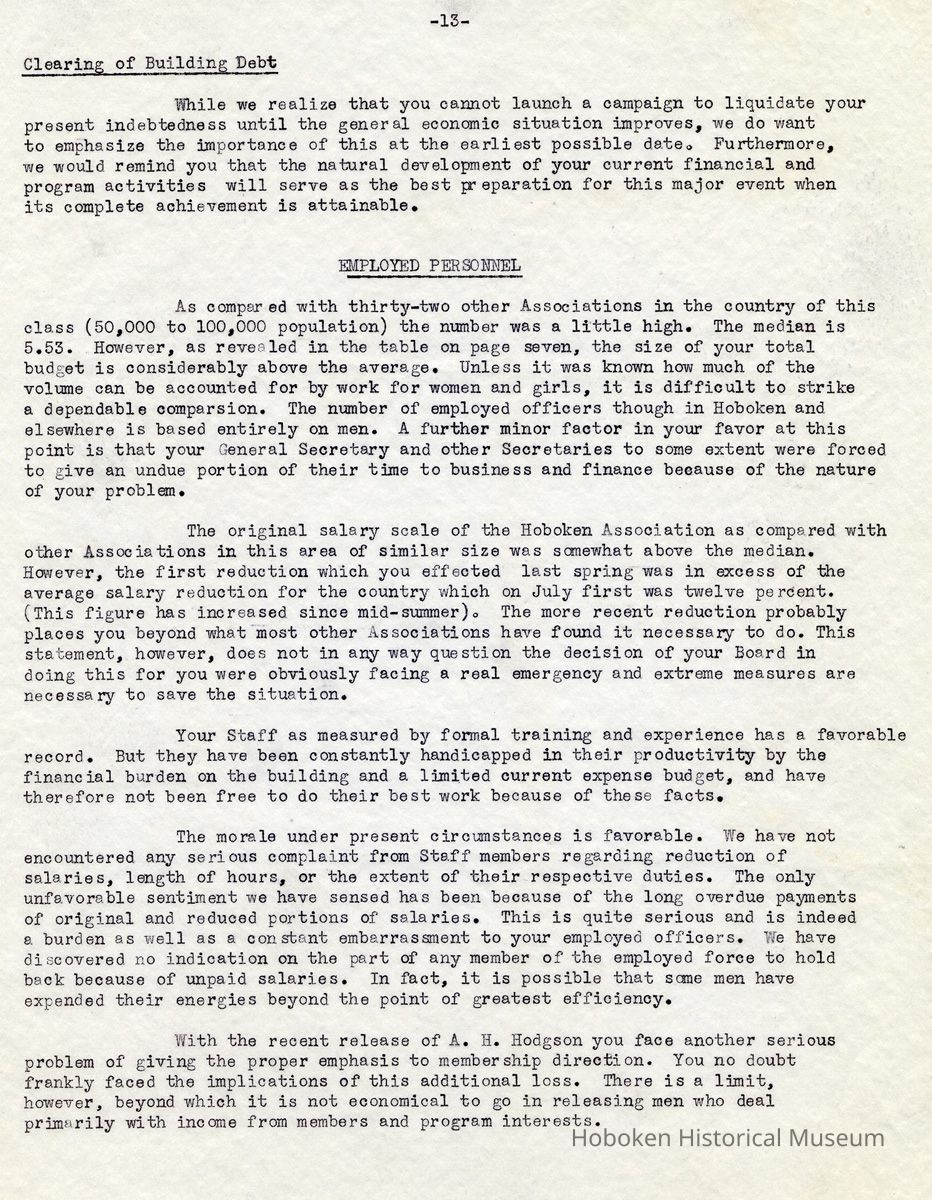
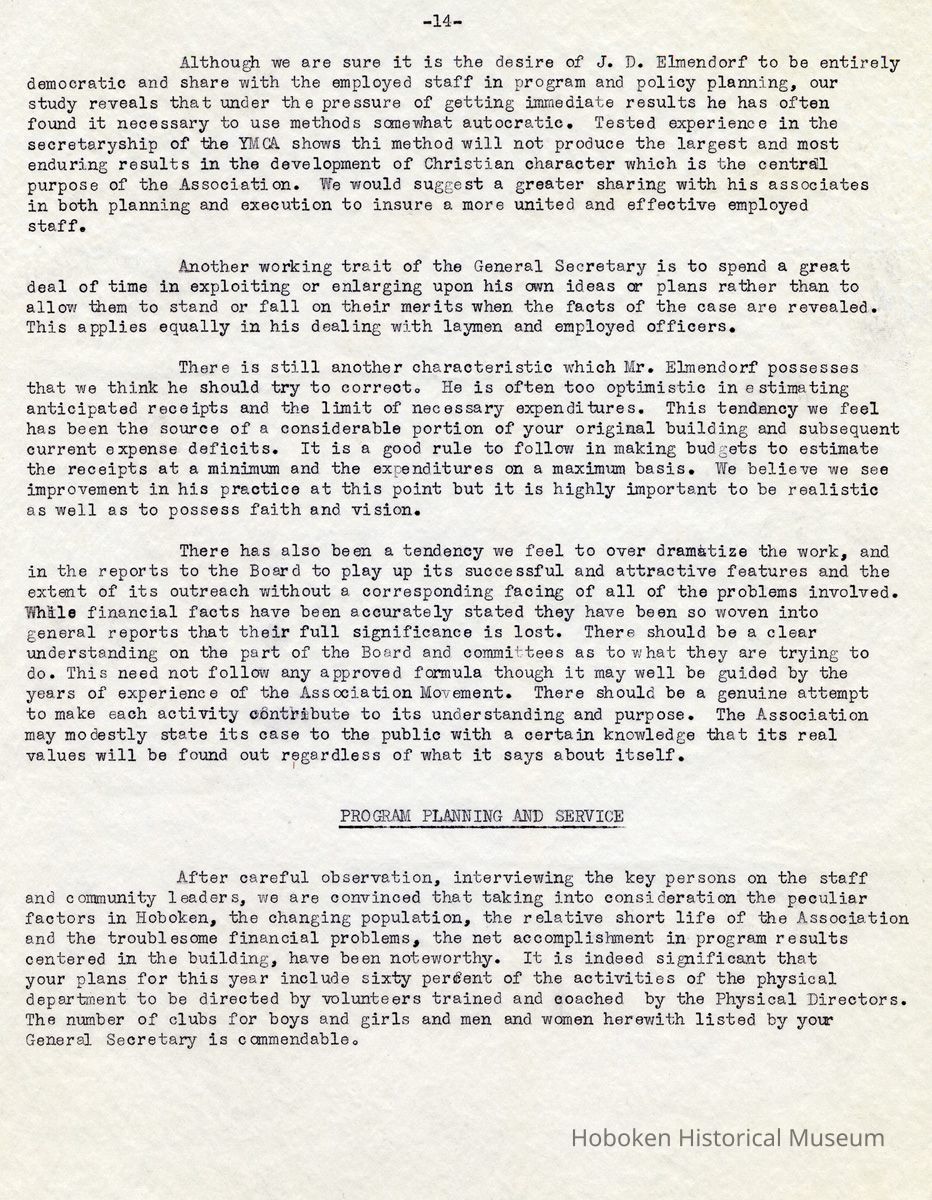
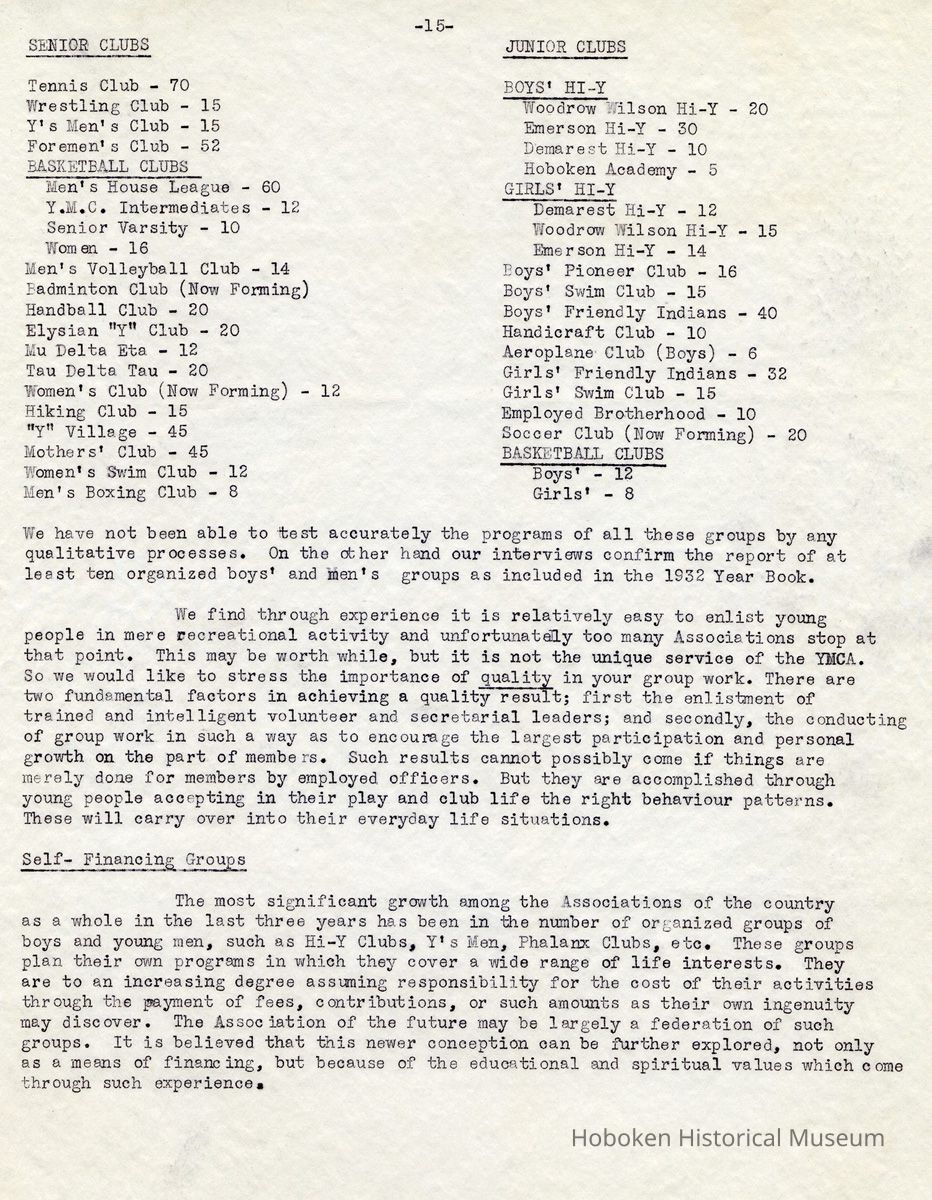
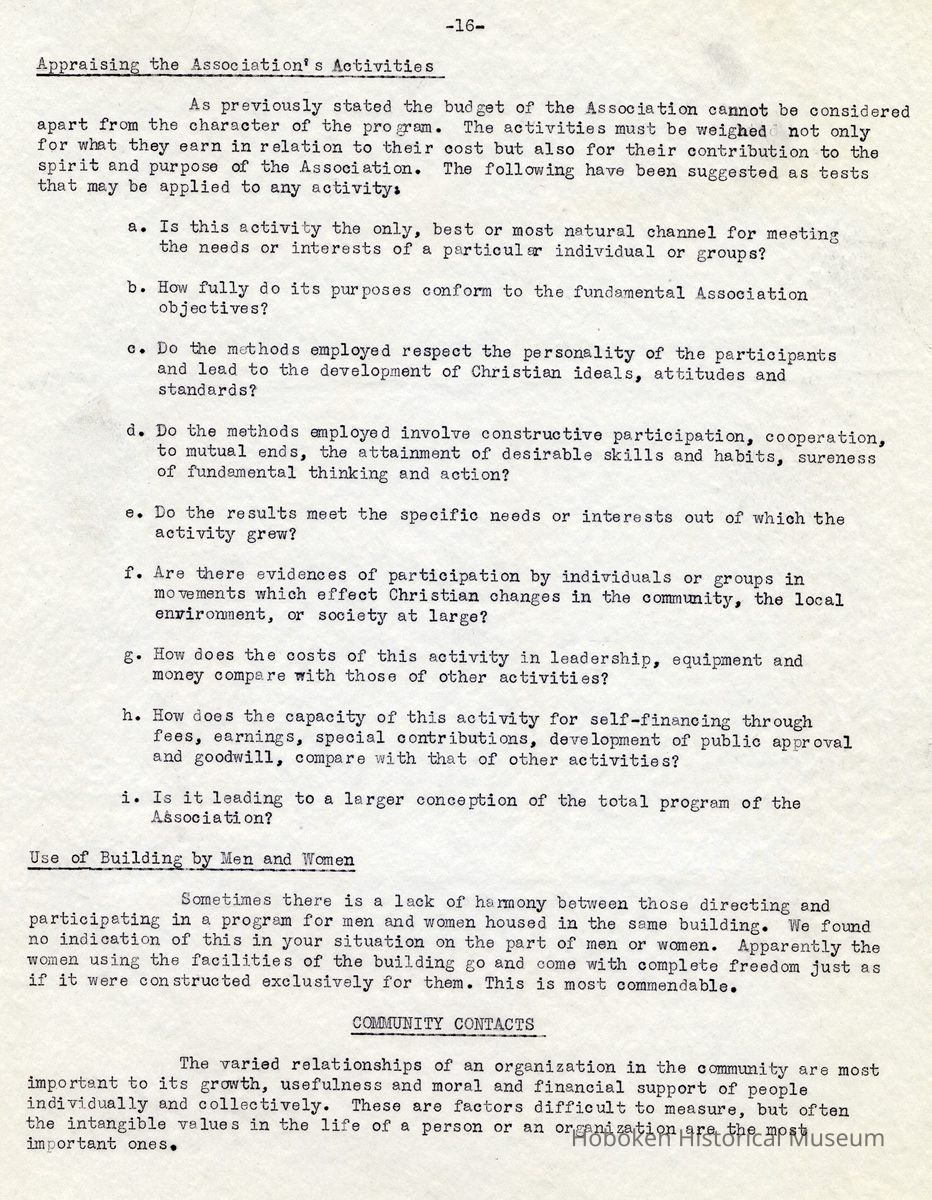
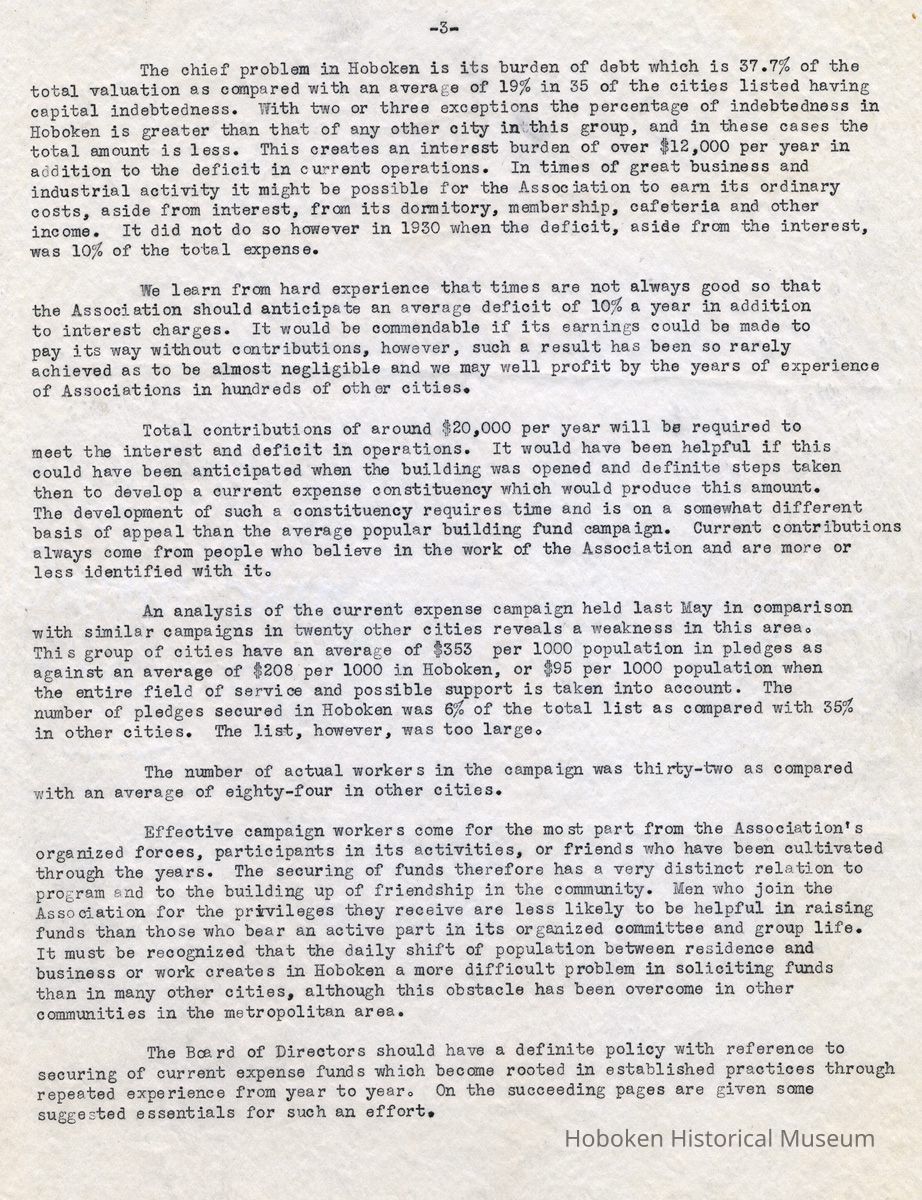
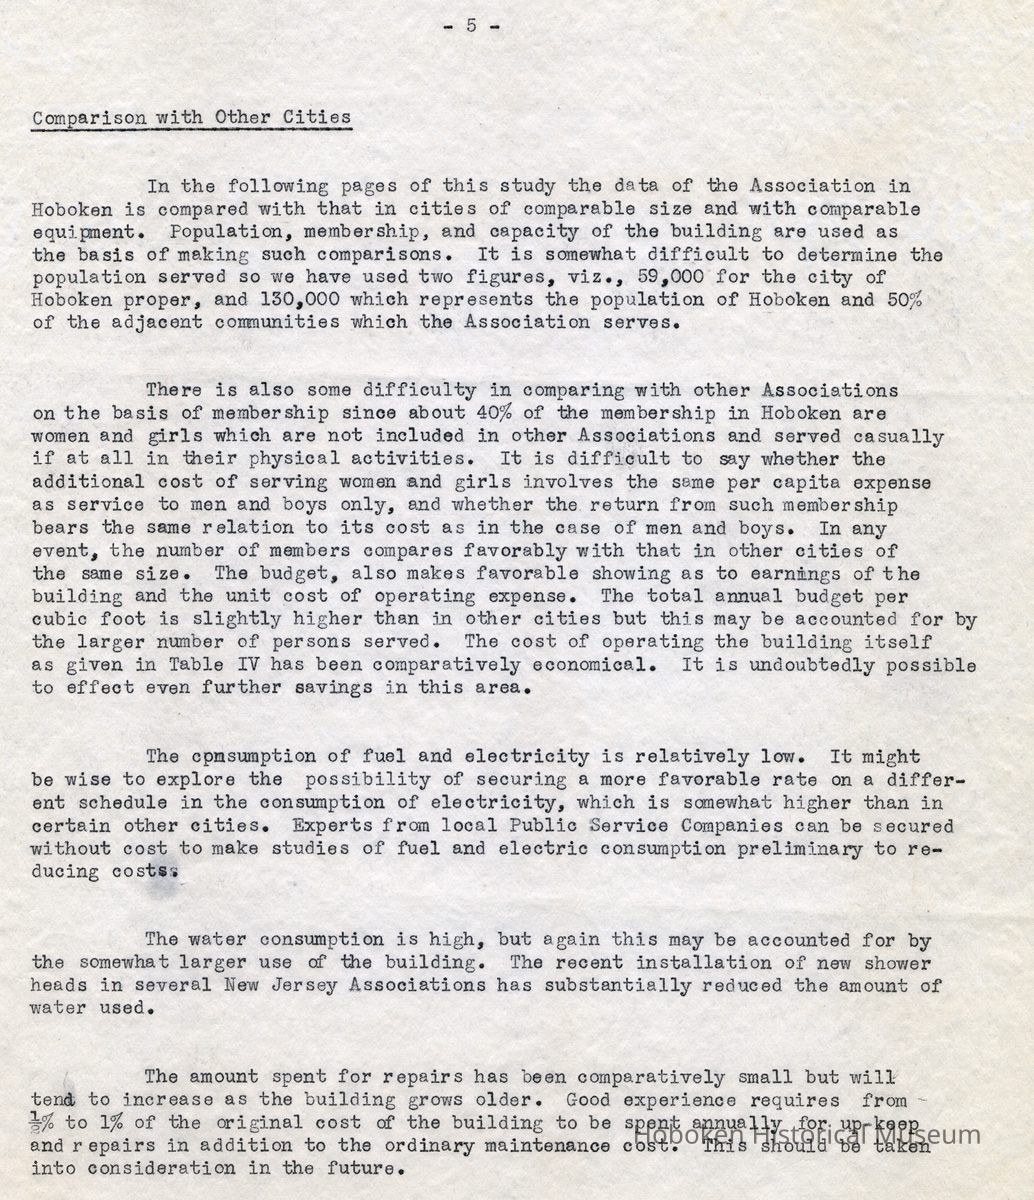
Notes: archives 2001.126.0083 - selected text (note the catalog program does not maintain format of tables so the information is present, but garbled; useful for keywords that are entered - refer to page images for tables) Studies of the Work of the Hoboken, New Jersey, Association Presented to the Board Directors, November 15, 1932. By: Urban Williams, State Secretary; I. B. Rhodes, Regional Executive. pg [1] November 15, 1932 BOARD OF DIRECTORS, YOUNG MEN'S CHRISTIAN ASSOCIATION, HOBOKEN, NEW JERSEY. Gentlemen: Through regular Board action on September 20th, you requested that the New Jersey State Committee take the leadership in making a study of the work of your organization since the opening of the present building in 1928. It being mutually understood that this work should be done without financial obligation on your part. The assignment has been assumed jointly by the National Council and the State Committee and the report is submitted on that basis by the Executive Secretaries of the Eastern Region of the National Council and the New Jersey State Committee. BUSINESS AND FINANCE A review and summary of the annual financial statement for the years ending April 30, 1930, 1931 and 1932, and the five months period, May 1st to September 30th, 19 32, has been compiled from the annaal financial statements and the reports to October 31st of the current year, as given on page 2. This is not an accurate audit but is designed to indicate average experience and tendencies. The annual statements of the Association for 1930-32 show income and expenditures by departments but do not give summaries for the entire year. The books are apparently kept in accordance with the standard system recommended by the Business Secretaries Association and the Bureau of Administration of the National Council, on the basis of actual expenses incurred each month regardless of when paid. The reports are incomplete in that they do not show the amount collected on building fund pledges and applied to current income. Such funds which it is understood were transferred by action of the Board of Directors, should be indicated in the same bracket with current subscriptions, and should also be shown on the balance sheets of capital resources and. liabilities. The use of capital funds for current expenditures is not generally a wise policy, though it is sometimes necessary where contribution to building funds make it difficult to secure subscriptions during the first year of occupancy of a new building. Such action should be upon an announced and pre-determined basis. The report shows an annual average deficit of 17.5% of the total operating expenses including interest. The rate for the first five months of the current fiscal year is somewhat higher but is doubtless due to smaller earnings during the summer months. Eliminating the interest item the current expense deficit varies from 4.7% to 10% of the total operating costs. This is well below the average for other cities of this size, which usually requires 15% to 20% of their total expense in contributions aside from interest. The report shows an accumulated difference between expenditures and current income of $72,706 up to September 30, 1932. The difference between this amount and the accounts payable as of October 1, 1932 is $37,665.85 is accounted for in part by -the application of building fund income to current accounts. There is also a write-off of current liabilities of $43,882.74 in the annual statement of April 30, 1931 which is accounted for by a reduction in the net worth of the Association. pg [2] EXPENDITURES YEAR ENDING APRIL 30 5 months ending 1930 1931 1932 Sept. 30 , 1932 Membership 5550 .32 6209, .57 3989 .29 602 .14 Physical 17297 a 80 20084 .78 11283 .31 3496 .75 Junior Dept. 6705 .36 9968 .25 8393. .35 3956 .20 Industrial & Employment 3827 .81 2510 .95 1500 .04 Educational 845 .71 380 .81 Social 3653 .85 6189 .32 1670 .01 816 .90 Dormitory 4566 .44 4561 .07 2464 .21 921 .60 Cafeteria 42250 .65 33466 .62 23723 .98 7254 .35 Building Maintenance 16549 .40 20035 .90 16829 .69 5457 .08 Sals & Wages (7092 .50) (8511 .69) (7529 .92) L.P.W. & F. (8229 .08) (8213 .97) (8100 .70) Repairs ( 336 .27) (1978 .79) ( 388 .62) Laundry 1489 .79 1493 .97 Business Office 16794 »70 16509 .17 Genl Administration 6407 .50 5780 .50 15749 .25 5094 .27 Insurance 909 .69 943 .16 908 .16 Total Operating Exp. 126849 .02 128134 .07 86511 .29 27599 .29 Interest,Capital & Cur. 13172 .36 12904 .36 12873 .34 5351 .05 TOTAL 140021 .38 141038 .43 99384 .63 32950 .34 RECEIPTS Memberships 18503.79 23745.78 17960.39 3533.15 Physical Dept. 6240.85 9418.23 3779.76 760.99 Boys Camp 1151.85 4805.23 5388.90 3043.12 Junior Dept. Miscel. 872.88 723.29 228.35 527.53 Indus. Educ.& Employment 3061.58 2088.17 752.86 Social 1713.87 2440.15 1252.37 242.15 Dormitory 30421.12 28490.95 22304.23 7813.05 Laundry & Tailor 749.22 672.35 587.33 Cafeteria 48280.85 40984.52 29270.25 8914.27 Miscel. Rentals 146.25 192.25 143.00 135.75 Laundry 2813.96 3217.47 Business Off. (Admin.) 275.65 595.20 744.98 201.33 TOTAL 114231.87 117373,59 82412.42 25171.34 CURRENT SUBSCRIPTIONS * 2983.75 11672.34 4942.79 114231.87 120357.34 94084.76 30114.13 Actual Defieit 25789.51 20681.09 5299.87 2836.21 Accum. Def. to 9/30/32 (inc. 5 118,099.23 prior to Apl.30, 1930) 72,705.23# Total Contrib.require- 25789.51 23665.84 16972.21 7779.00 ments % Exps. including Int. 18.4$ 16.7% 17.1% 23.6% Same without Interest 12617.15 10811.82 4098.87 2427.95 % of Exps. 10.% 8.4% 4.7% 8.8% * Does not include $18,367.56 of Building Funds applied to current income # There is a slight discrepancy between this figure and the total of all deficits reported in the annual Balance Sheets. The Auditors statement of April 30, 1932, shows a book deficit of $109,901.37. pg 3 -3- The chief problem in Hoboken is its burden of debt which is 57.9% of the total valuation as compared with an average of 19% in 35 of the cities listed having capital indebtedness. With two or three exceptions the percentage of indebtedness in Hoboken is greater than that of any other city in this group, and in these cases the total amount is less. This creates an interest burden of over $12,000 per year in addition to the deficit in current operations. In times of great business and industrial activity it might be possible for the Association to earn its ordinary costs, aside from interest, from its dormitory, membership, cafeteria and other income. It did not do so however in 1930 when the deficit, aside from the interest, was 10% of the total expense. We learn from hard experience that times are not always good so that the Association should anticipate an average deficit of 10% a year in addition to interest charges. It would be commendable if its earnings could be made to pay its way without contributions, however, such a result has been so rarely achieved as to be almost negligible and we may well profit by the years of experience of Associations in hundreds of other cities. Total contributions of around $20,000 per year will be required to meet the interest and deficit in operations. It would have been helpful if this could have been anticipated when the building was opened and definite steps taken then to develop a current expense constituency which would produce this amount. The development of such a constituency requires time and is on a somewhat different basis of appeal than the average popular building fund campaign. Current contributions always come from people who believe in the work of the Association and are more or less identified with it. An analysis of the current expense campaign held last May in comparison with similar campaigns in twenty other cities reveals a weakness in this area,. This group of cities have an average of $353 per 1000 population in pledges as against an average of $208 per 1000 in Hoboken, or $95 per 1000 population when the entire field of service and possible support is taken into account. The number of pledges secured in Hoboken was 6% of the total list as compared with 35% in other cities. The list, however, was too large. The number of actual workers in the campaign was thirty-two as compared with an average of eighty-four in other cities. Effective campaign workers come for the most part from the Association's organized forces, participants in its activities, or friends who have been cultivated through the years. The securing of funds therefore has a very distinct relation to program and to the building up of friendship in the community. Men who join the Association for the privileges they receive are less likely to be helpful in raising funds than those who bear an active part in its organized committee and group life. It must be recognized that the daily shift of population between residence and business or work creates in Hoboken a more difficult problem in soliciting funds than in many other cities, although this obstacle has been overcome in other communities in the metropolitan area. The Board of Directors should have a definite policy with reference to securing of current expense funds which become rooted in established practices through repeated experience from year to year. On the succeeding pages are given some suggested essentials for such an effort. pg [4] ANALYSIS OF CAMPAIGN REPORTS IN 20 CITIES DURING LAST YEAR From Reports of Financial Service of the National Council Prospects Workers CITY Month Popn. Objective Amt.Secured Listed Covered Signed Enlisted Producing Somerville, Mass. Sept 104 $17,775 $16,375 3922 1751 512 89 41 Rye, N. Y. Jan 9 24,746 14,580 1750 900 466 87 65 Morristown, N.J. Apl 15 32,014 24,457 5530 3250 1280 161 - Ridgewood, N.J. Feb 12 31,948 23,890 3054 3008 1664 Kansas City, Ks. Jan 121 19,971 20,138 3001 2621 1522 157 127 Tulsa, Okla June 141 49,785 50,092 6436 4433 1609 226 195 Red Bank, N.J. Feb 11 8,500 8,774 1136 985 514 90 74 Elgin, 111. Jan 35 11,185 11,344 2364 1635 717 141 115 Waukegan, 111. Dec 33 15,970 13,368 2370 1700 619 124 90 Summit, H" J. Oct 14 26,642 26,654 2916 2719 1446 170 157 Camden, N. J. Apl 119 35,500 35,510 3034 2100 1134 158 140 Newark, 0. Apl 30 15,000 11,303 3190 2660 1117 Glendale, Cal. Apl 63 25,000 21,046 4746 4381 1429 154 142 Redlands,Cal. Nov. 14 13,500 13,549 1641 1635 825 125 96 Shreveport, La. Dec. 76 30,000 18,342 4600 4300 1032 200 180 Little Rock, Ark. Dec. 81 24,913 20,251 3840 3525 1456 Utica, N.Y. Nov. 102 36,000 25,453 6000 6000 3633 Columbus, Ga. Sept 43 10,000 8,975 1600 1350 552 90 72 Atlantic City,NJ Sept 66 15,000 11,794 2600 1350 675 138 92 Port Chester,NY Nov 23 20,550 17,218 2340 1972 991 119 98 TOTALS 1112 463,999 393,113 66,070 52,275 23,191 2068 1684 Av. % of Achievement Averages 56 23,200 29.655 84.7% $353 per M 33oo 60 per M 26,111 79% 1160 Av. 17.00 130 105 81% Page 5 Comparison with Other Cities In the following pages of this study the data of the Association in Hoboken is compared with that in cities of comparable size and. with comparable equipment. Population, membership, and capacity of the building are used as the basis of making such comparisons. It is somewhat difficult to determine the population served so we have used two figures, viz., 59,000 for the city of Hoboken proper, and 130,000 which represents the population of Hoboken and 50% of the adjacent communities which the Association serves. There is also some difficulty in comparing with other Associations on the basis of membership since about 40% of the membership in Hoboken are women and girls which are not included in other Associations and served casually if at all in their physical activities. It is difficult to say whether the additional cost of serving women and girls involves the same per capita expense as service to men and. boys only, and whether the return from such membership bears the same relation to its cost as in the case of men and boys. In any event, the number of members compares favorably with that in other cities of the same size. The budget, also makes favorable showing as to earnings of the building and the unit cost of operating expense. The total annual budget per cubic foot is slightly higher than in other cities but this may be accounted for by the larger number of persons served. The cost of operating the building itself as given in Table IV has been comparatively economical. It is undoubtedly possible to effect even further savings in this area. The consumption of fuel and electricity is relatively low. It might be wise to explore the possibility of securing a more favorable rate on a different schedule in the consumption of electricity, which is somewhat higher than in certain other cities. Experts from local Public Service Companies can be secured without cost to make studies of fuel and electric consumption preliminary to reducing costs's The water consumption is high, but again this may be accounted for by the somewhat larger use of the building. The recent installation of new shower heads in several New Jersey Associations has substantially reduced the amount of water used. The amount spent for repairs has been comparatively small but will tend to increase as the building grows older. Good experience requires from 1/2 %to 1% of the original cost of the building to be spent annually for up~keep and repairs in addition to the ordinary maintenance cost. This should be taken into consideration in the future. page [6] TABLE III-A Average of 45 Comparable Cities Hoboken City only (Men & Boys) Hoboken Nor. Hudson (All Members) POPULATION 69,700 59,000 130,000 VALUE OF ASSOCIATION PROPERTY Av. per Capita Investment per Member $437,000 $ 6.27 $ 388. $618,000 10.49 $597 m & b $618,000 4.75 $343 all membs CAPITAL INDEBTEDNESS % of Valuation Av. per 1000 population $ 73,000 19 % $ 1035 $233,500 37.7 % 3,950 $233,500 37.7% 1,790 ANNUAL BUDGET to APL 30,'32 Av. per 1000 population Av. per memb. Av. per cu. ft. $ 68,200 $ 980 $ 60.70 10.35 cts $ 99,384 $ 1,685 $# 96.00 m & b 13.8 cts $ 99,384 $ 760 $ 55.20 all memb* 12 cts (without Int.) INCOME FROM BUILDING Av. per cu. ft. Av. per 1000 population $ 48,125 6 cts $ 480. $ 51,600 7.2 cts $ 870. $ 51,600 7.2 cts $ 400. NO. OF MEMBERS Income from Members Av. per memb. 1122 $ 13,250 $ 11.80 1035 m & b $ 11,700 $ 11.30 1808 all membs $ 17,960 $ 9.97 CONTRIBUTION INCOME Av. per 1000 population Av. per member % of total expense $ 16,300 $ 234. $ 14.50 23.8% TABLE 111-B $ 11,672 $ 198. $ 11.30 m & b 17.1$ $ 11,672 $ 90. $ 6.50 all membs 17.1$ 67 Cities 50 - 100,000 47 Cities 100 - 200,000 Av. Population Average total Budgets Average Contribution Income % of Total ATerage per 1000 Population 69,500 $57,000 14,700 25.9% $212. $ $ 133,000 111,000 24,600 22.2% 185. Status: OK Status By: dw Status Date: 2011-05-20
![pg [1]](https://d8e7jbdw4fu0e.cloudfront.net/11047/d31bbe70-fa4d-11ed-a641-b3912f9925a9-vd29T4C.lg@2x.jpg)
![pg [2] Expenditures Year Ending April 30 [1932]](https://d8e7jbdw4fu0e.cloudfront.net/11047/d44d3990-fa4d-11ed-a641-b3912f9925a9-vd29T4C.lg@2x.jpg)
![pg [4] ANALYSIS OF CAMPAIGN REPORTS IN 20 CITIES in last year](https://d8e7jbdw4fu0e.cloudfront.net/11047/d6b008c0-fa4d-11ed-a641-b3912f9925a9-vd29T4C.lg@2x.jpg)
![pg [6] Table III-A; Table III-B](https://d8e7jbdw4fu0e.cloudfront.net/11047/d9134d20-fa4d-11ed-a641-b3912f9925a9-vd29T4C.lg@2x.jpg)
![pg [7]](https://d8e7jbdw4fu0e.cloudfront.net/11047/da4404f0-fa4d-11ed-a641-b3912f9925a9-vd29T4C.lg@2x.jpg)
![pg [8] Table IV](https://d8e7jbdw4fu0e.cloudfront.net/11047/db7531f0-fa4d-11ed-a641-b3912f9925a9-vd29T4C.lg@2x.jpg)